
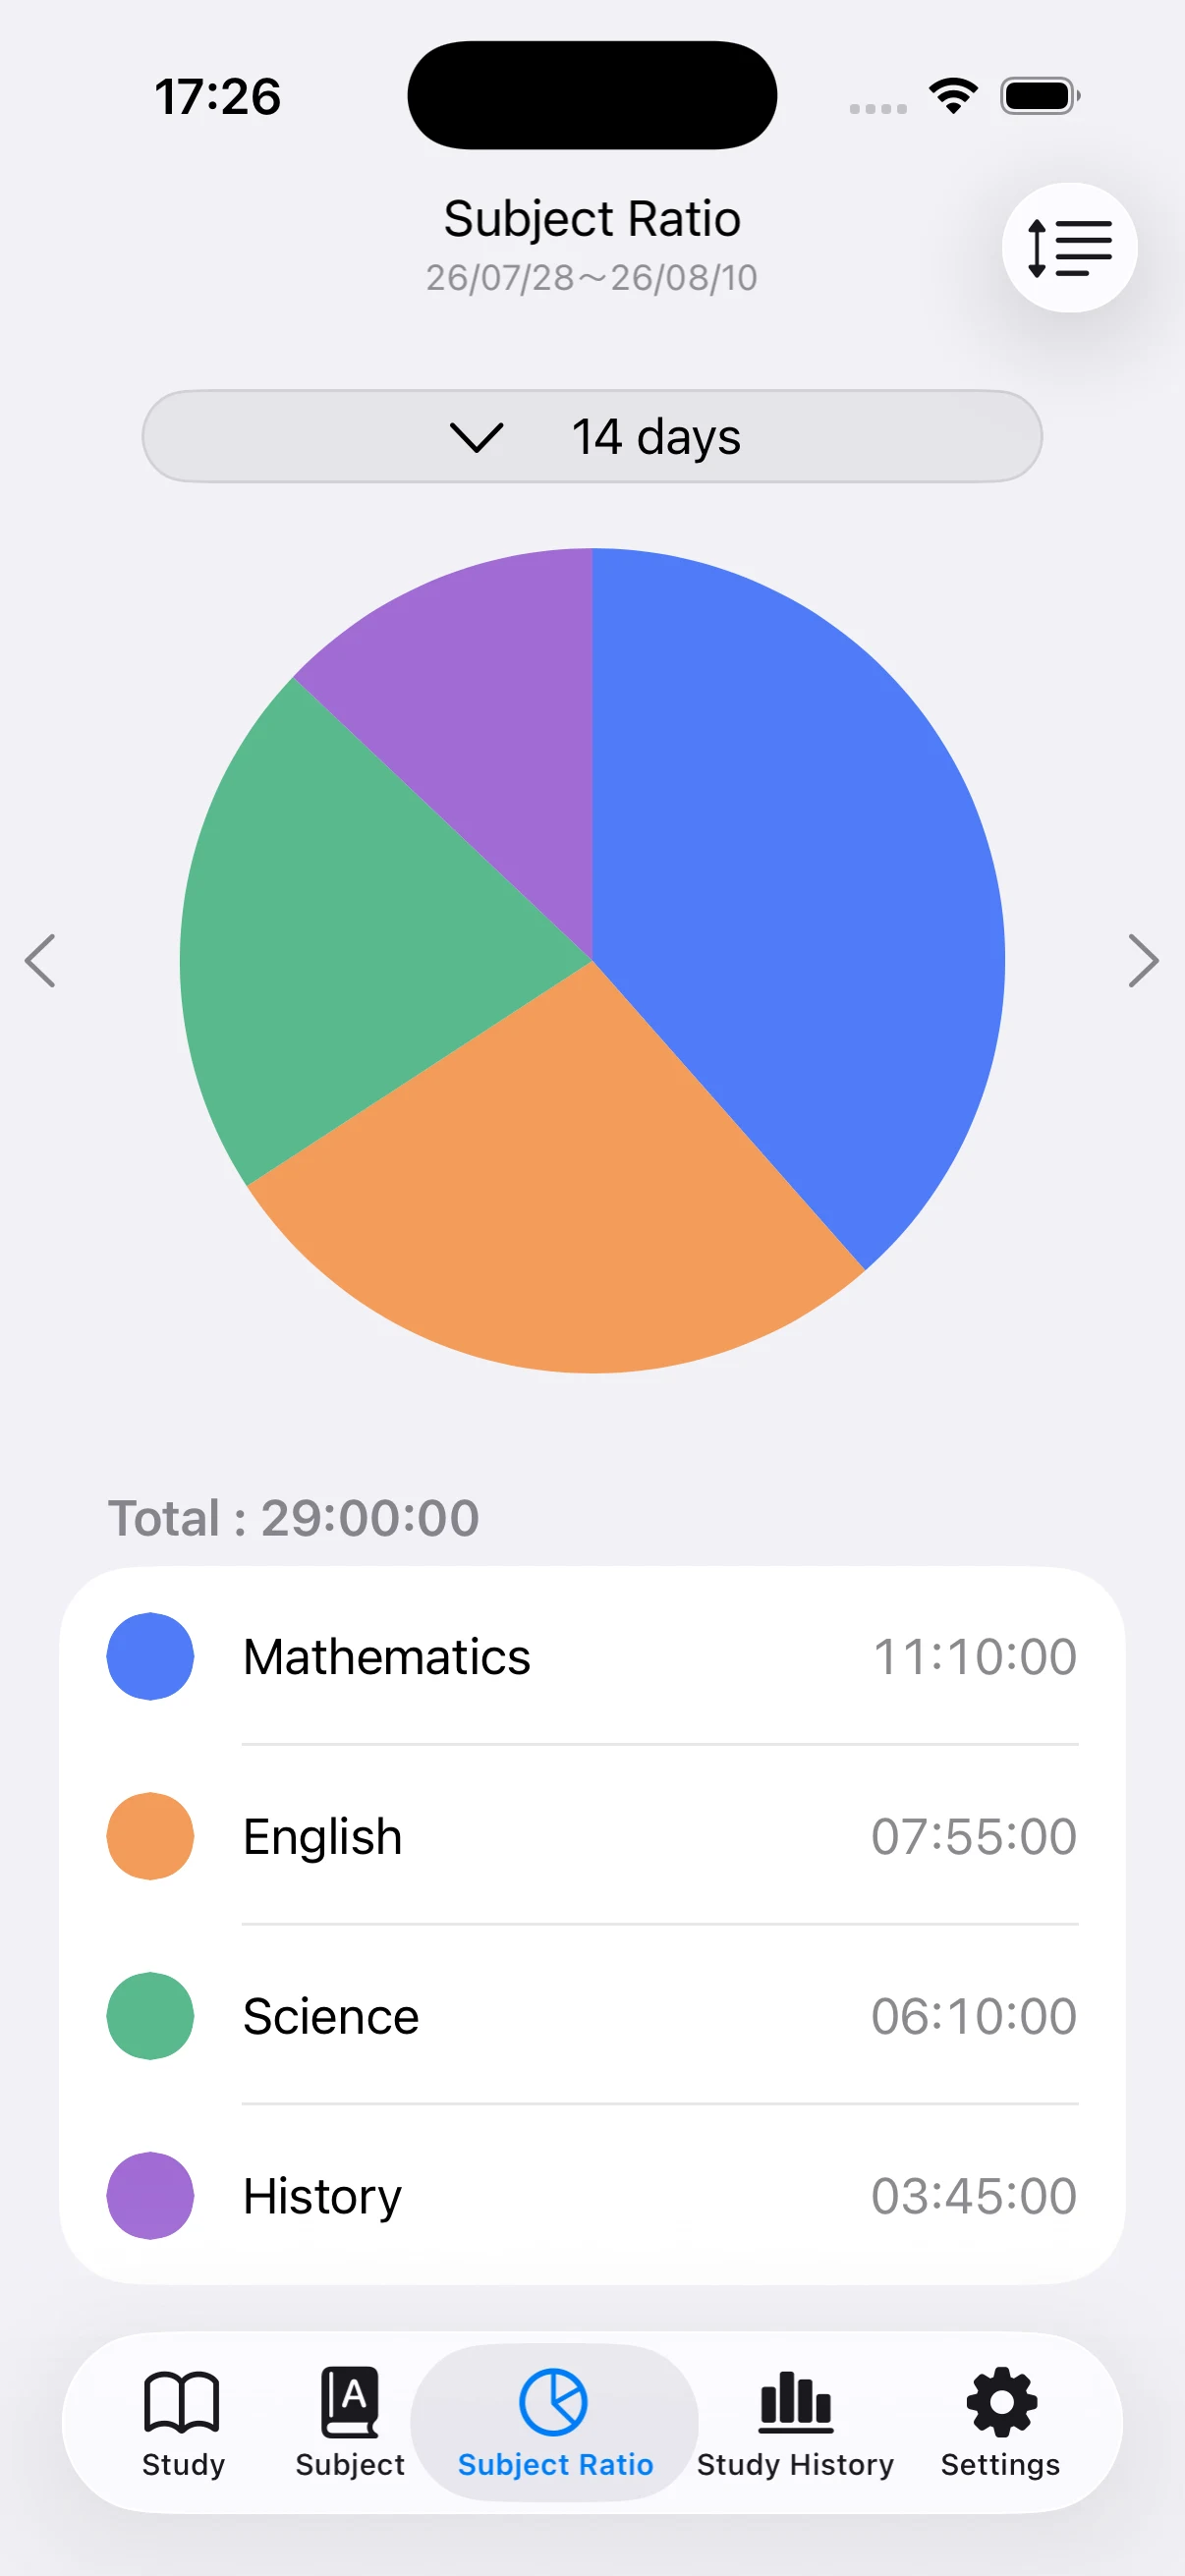
Check subject balance in the pie chart
The Subject Ratio view shows how the selected period is divided among your subjects. Look beyond the total and check whether an important subject is underrepresented or one area is taking more time than planned.
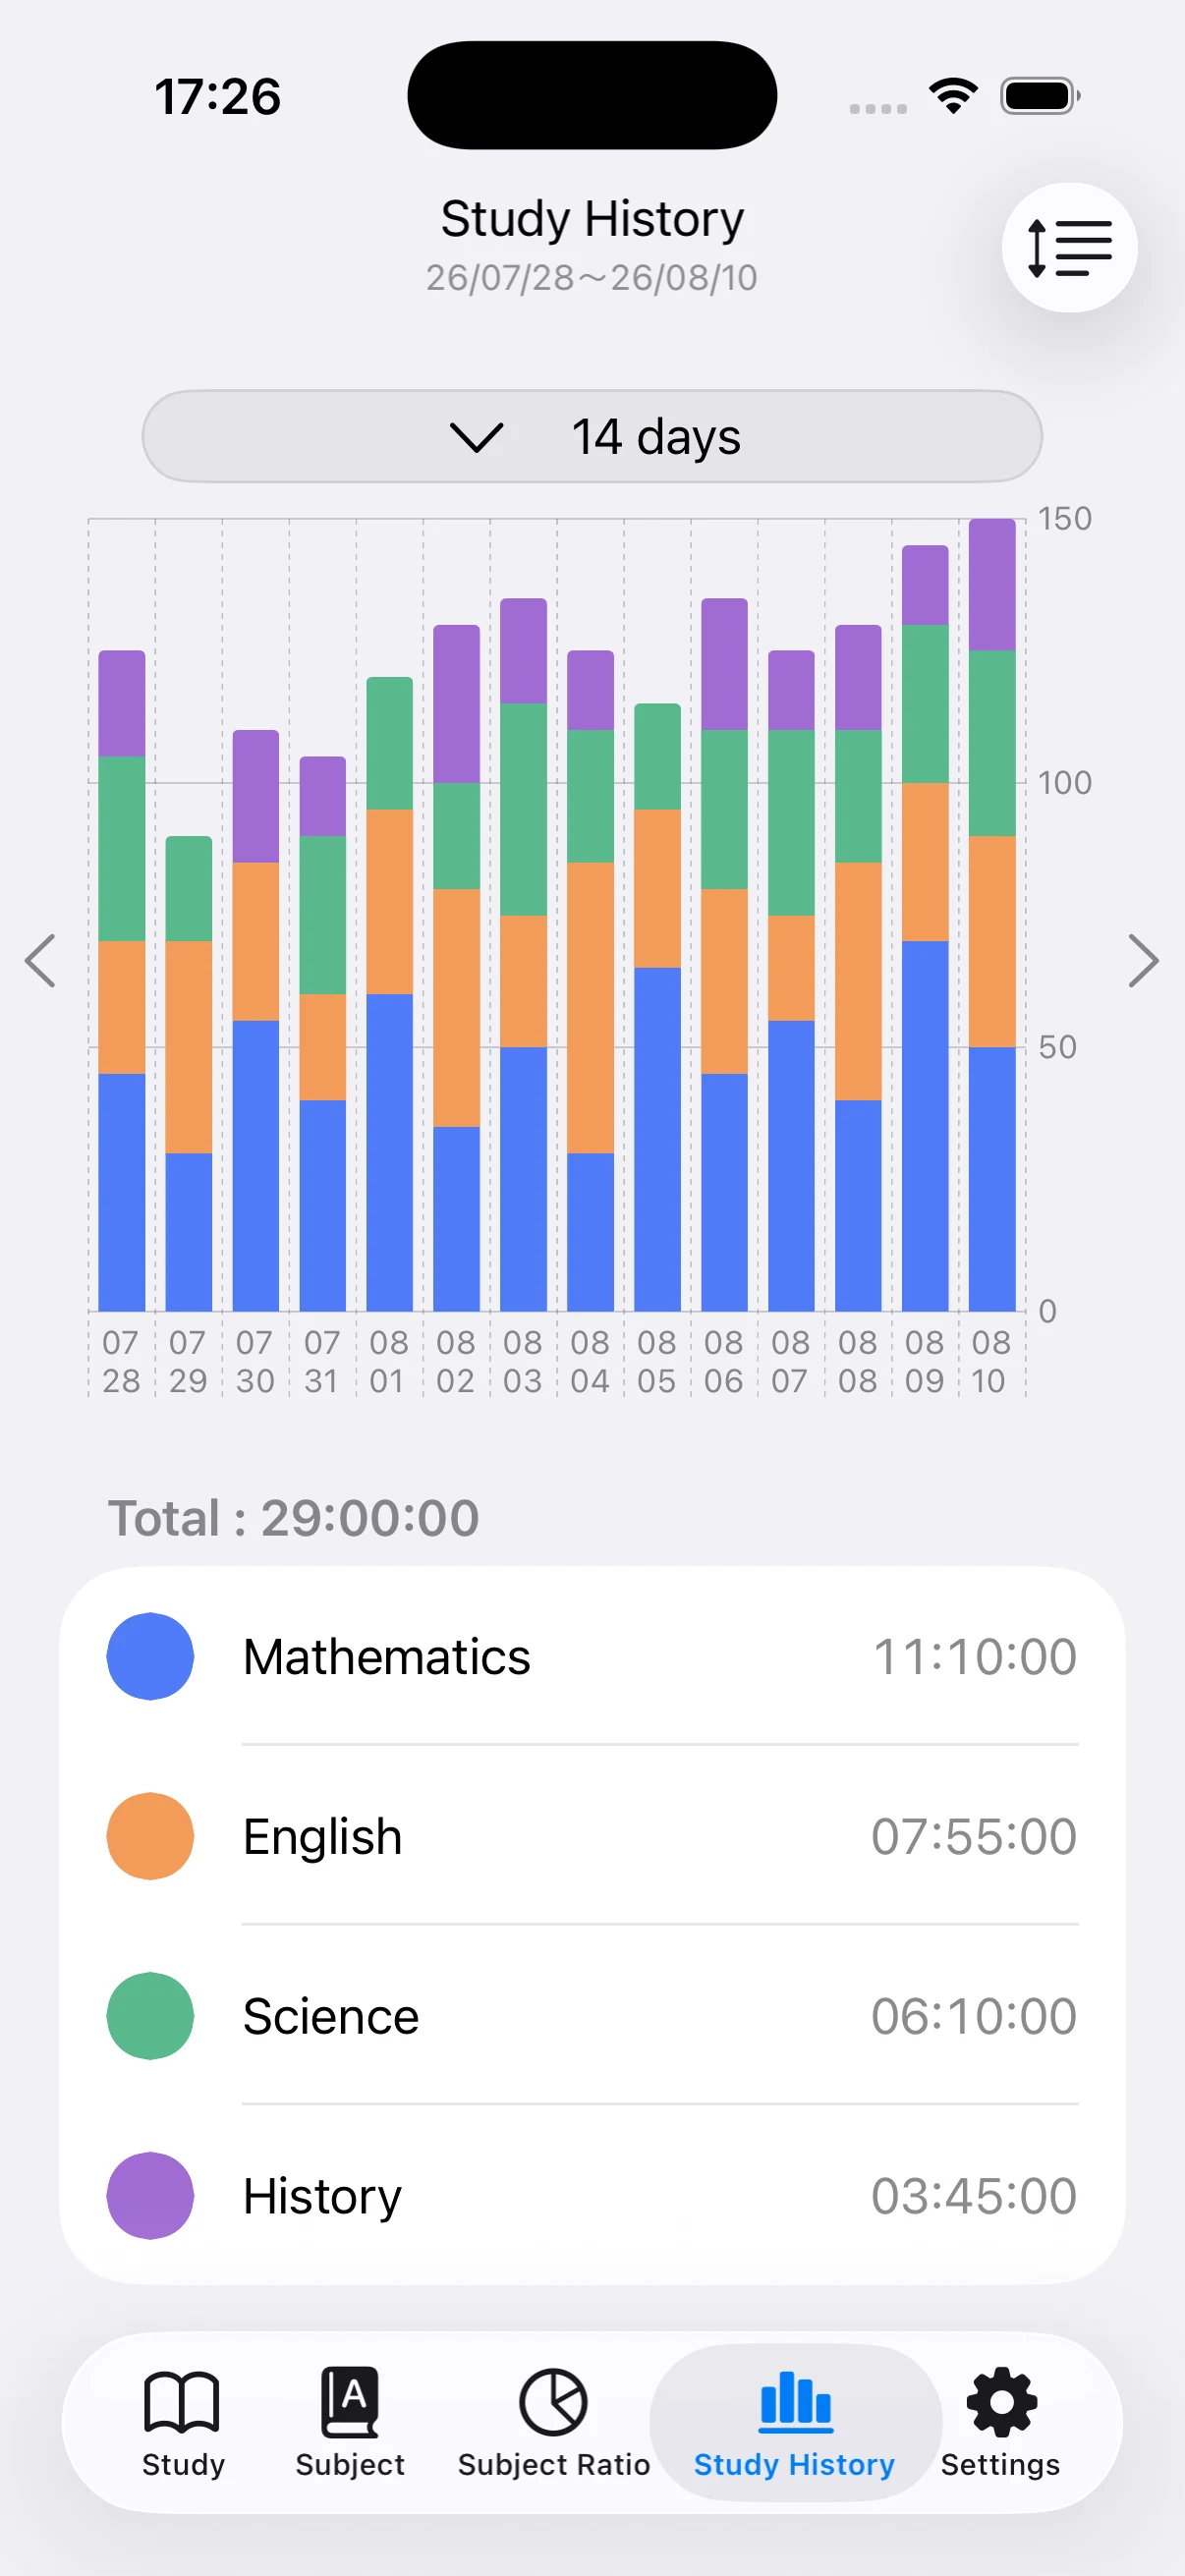
Check daily consistency in the bar chart
The stacked history chart combines total daily time with its subject breakdown. It can reveal patterns such as long weekend sessions, empty weekdays, or a sudden increase just before an exam.
Change the date range for your goal
Use a short range to inspect a recent habit and a longer range to review an exam-preparation period. Comparing ranges of similar length gives a more useful picture than judging progress from a single day.
Treat time as one signal, not the final result
Recorded time measures effort, not understanding by itself. Use the charts together with completed chapters, review frequency, practice scores, and upcoming deadlines when you adjust your plan.
Keep the system simple enough to maintain
Start with the major subjects instead of creating a category for every small task. You can add detail later. If you miss a day, resume at the next session rather than abandoning the record.